Band Scanner GPS
search
  • Band Scanner GPS
  • Band Scanner GPS
  • Band Scanner GPS
  • Band Scanner GPS
  • Band Scanner GPS
  • Band Scanner GPS
  • Band Scanner GPS
  • Band Scanner GPS
  • Band Scanner GPS
  • Band Scanner GPS
  • Band Scanner GPS
  • Band Scanner GPS
  • Band Scanner GPS
  • Band Scanner GPS
  • Band Scanner GPS
  • Band Scanner GPS
  • Band Scanner GPS
  • Band Scanner GPS
  • Band Scanner GPS
  • Band Scanner GPS
  • Band Scanner GPS
  • Band Scanner GPS
  • Band Scanner GPS
  • Band Scanner GPS
  • Band Scanner GPS
  • Band Scanner GPS

Band Scanner GPS

£995.00
Tax excluded
Small Box – Superb Characteristics!

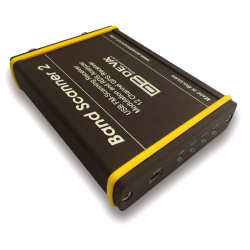
The Band Scanner GPS enables you to evaluate FM broadcast band congestion and to log stations’ identification parameters. This device is a Google Earth compatible tool with a built-in GPS Receiver generating a display of the collected FM Radio measurements. The Log file can be exported as a .kmz file or a transitional format and saved for future analysis.

Quantity


Security policy


Delivery policy

Pocket-sized and USB-powered, the Band Scanner GPS is the perfect device for field work. This unit can measure RF level, MPX deviation, Left & Right Audio levels, RDS and Pilot injection levels. The measurement results can be easily displayed in Google Earth. The band scan range is from 87 to 108 MHz. The supplied - free of charge - Windows software sweeps the receiver across the FM band, logging every carrier and generating a spectrum display of carrier level vs. frequency. It then analyzes each carrier and creates a station list.
Small Box – Superb Characteristics!

\n

\n
  • \n
  • FM Band 87 – 108 MHz Spectrum analyzer \n
  • MPX, PILOT & RDS deviation meters \n
  • Built-in Stereo decoder; LEFT and RIGHT level meters \n
  • Built-in 12-channels GPS Receiver \n
  • Measurement results visualisation in Google Earth \n
  • Auto search tuning \n
  • Headphones audio output \n
  • Full feature RDS and RBDS decoder \n
\n
  • \n
  • RDS/RBDS Groups Detector & Analyzer \n
  • RDS/RBDS Stream BER meter \n
  • FM/RDS/RBDS Data Logger \n
  • View playlists of the competitive stations \n
  • Saving and exporting the playlists to Excel file \n
  • Compare the signal strength to competitors and other stations \n
  • Pocket size USB powered box. No external power supply required \n
  • Tracking all the detailed histories saved in the RDS Data Log \n
\n

\n

\n \nThis is a tool to evaluate FM broadcast band congestion and to log station identification parameters."Band Scanner GPS" is a Google Earth compatible tool for visualization of collected FM Radio measurements. When running a campaign with the "Band Scanner GPS", the results will be saved in a Log file. "Band Scanner GPS" can then convert this file into KMZ format and the results could be viewed on Google Earth. The Log file can be exported also as transitional format for future analysis or to kept in record. The "Band Scanner GPS" can measure RF level, MPX deviation, Left & Right Audio levels, RDS and Pilot injection levels. The system is powered by the USB port of any Windows PC. Supplied free of charge Windows software sweeps the receiver across the FM band, logging every carrier and generating a spectrum display of carrier level vs. frequency. It then analyzes each carrier and creates a station list. Stations with an RDS presence are further refined to show all the radio data groups that were being transmitted. Its interface is like a portable radio's: It may be tuned manually through the receiver screen or by double-clicking a point on the spectrum plot or an entry on the station list. Spectrum plots may be saved as jpg or bmp files. The RDS data error level is graphed in a separate window on the receiver screen. The program can be monitored with headphones plugged into a standard 1/8" jack. \n \n

You might also like

Comments (0)
No customer reviews for the moment.